Before going into the details of the tool, it is important to understand how the general interface of linkfacts works outside the graphs.
Linkfacts top-bar #
The top bar of Linkfacts contains several tabs.
It first includes a search bar and the Linkfacts logo, which corresponds to the platform’s home page if you click on it.

At the top right of the bar, you will find several different sections :
- Community
- Teams
- My Graphs
- Adding a graph
- Notifications
- Profile

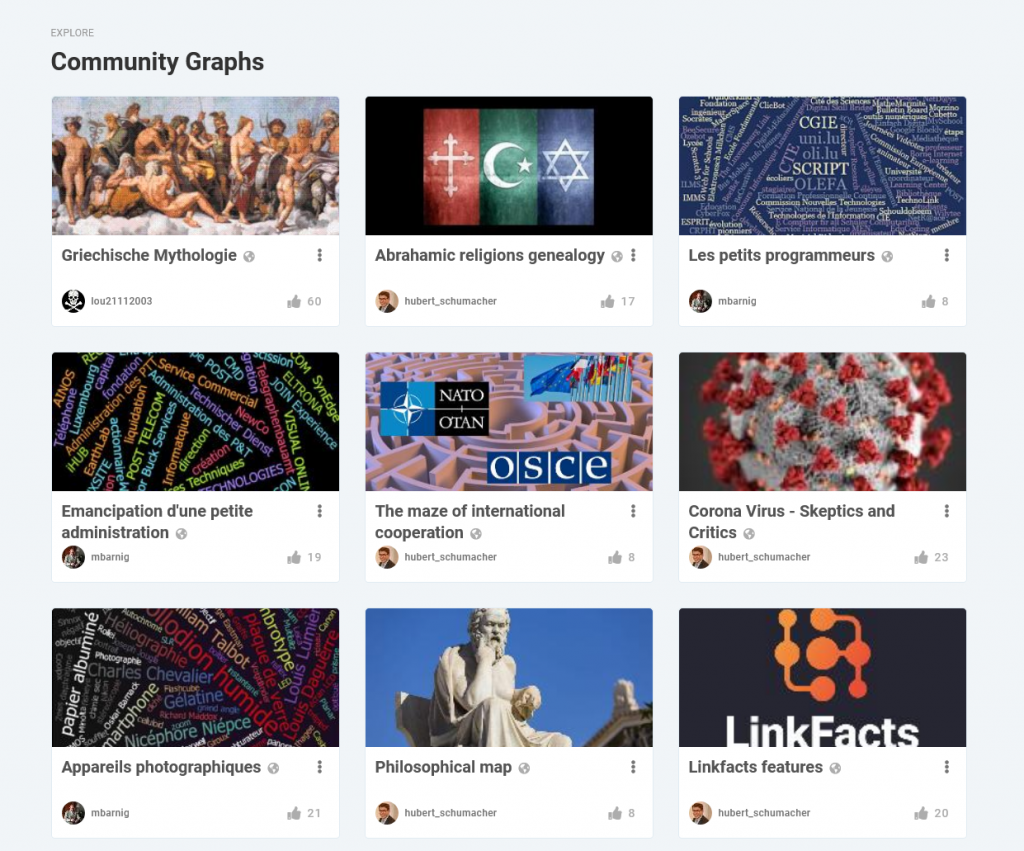
Community #
The linkfacts community section gathers all the public graphs of the platform. By default, they are sorted according to the number of likes they have received from the user community.

Teams #
On the “teams” sections, you’ll find all the teams to which you belong.
Here you also have the possibility to create new teams. Teams allow you to collaborate on graphs in a simplified way.

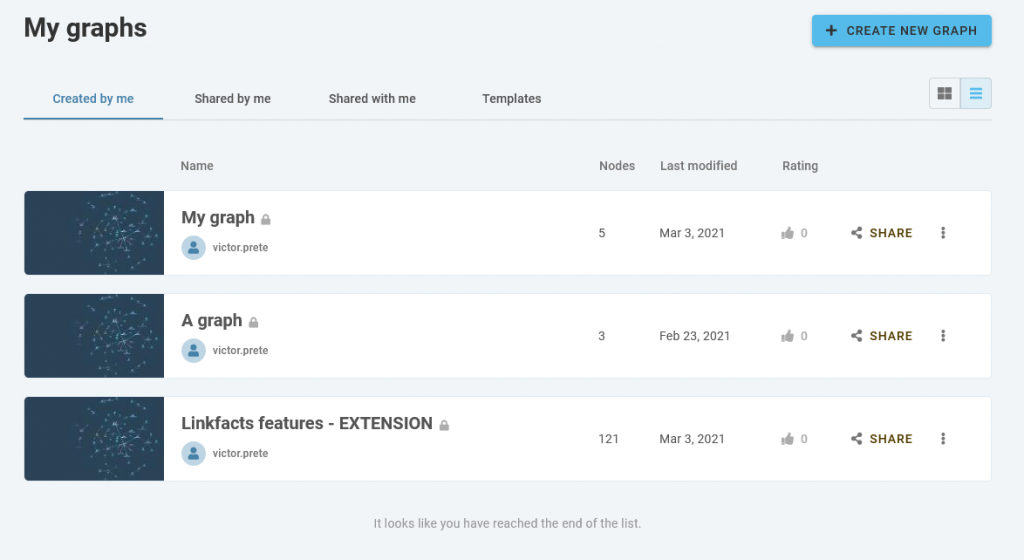
My graphs #
The “My graphs” section represents all the graphs that you have created or that have been shared with you, wether they are public or private.
It also contains your graph “templates”.

Notifications #
The bell icon corresponds to Linkfacts notifications.
You will receive notifications on many occasions : when a graph you subscribe to has been updated, when you are added to a team, etc.

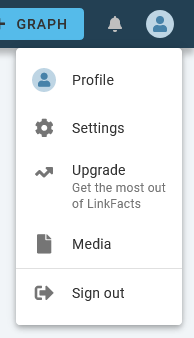
Profile section #
Finally on the last section, you’ll have access to numerous options linked to your user profile :
- Change account settings.
- Upgrade to a new plan.
- Go to your media library.
- Sign out.

Let’s now move on to the creation of your first graph!


